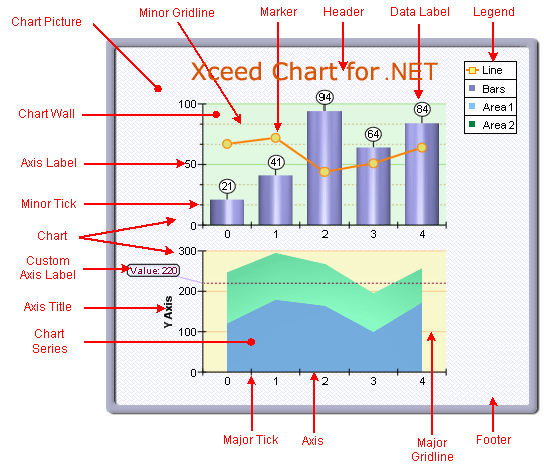
Chart images are assembled from various elements such as a series, walls, a legend, axes, etc. Each element corresponds to an object in the Xceed Chart for WinForms component.
The following figure illustrates the various chart elements and is followed by a brief description of each element.

Axis Label
A label along an axis. By default it is automatically generated from the Current Axis Scale. The user can turn automatic label generation off and supply custom strings, which will be displayed next to the major tick values. See the Axis Texts topic for more information.
Custom Axis Label
A user-defined label at a specific Axis value. Each Custom Axis Label is represented by an instance of the ChartLabel class.
Axis Title
The title of an axis. It is controlled by the Title property of the Axis object. See the Axis Texts topic for more information.
Chart
The Chart Picture consists of one or more Charts. Each chart is represented by a 3D parallelepiped. Each Chart can draw a Series, Walls, Axes, Grid Lines, Tick Marks, etc. Represented by the Chart class.
Chart Picture
The Chart Picture, or Chart Image, is the entire image that is produced, and corresponds to the root ChartControlBase class, from which the ChartControl derives.
Chart Series
A Chart Series, usually referred to simply as a Series, is a related group of data points. Chart Series form the primary building blocks from which a Chart Type is constructed. Simple charting types in general require only one Chart Series, for example, Pie, Bar, Line, etc. More complex Charting Types can require several Chart Series, such as Stack Bar, Stack Line, Pareto, etc. For more information, please refer to the General Concepts and Terminology topic.
Axis
Axes serve to scale the series displayed by the Chart. Note that some series do not require axis scaling (Pie for example). Each Axis is represented by an instance of the Axis class. See the Axis Overview topic for more information.
Legend
The legend for the Chart Picture. Xceed Chart for WinForms can have multiple legends. Each Chart can be described on one or more legends. Legends are represented by the Legend class (see also the Legend topic). The information displayed for each Series in the legend is controlled on a per-Series basis with the SeriesLegend class attached to each series.
Major And Minor Grid Lines
The major and minor horizontal and vertical grid lines. These lines are rendered at positions defined by the Major and Minor Tick Marks. See the Axis Grid Lines topic for more information.
Major And Minor Tick Marks
Major and minor horizontal and vertical tick marks are generated by the active Axis Scale. See the Axis Ticks topic for more information.
Chart Wall
The Chart has five standard Chart Walls: Left, Back, Right, Front, and Floor. Each one is represented by the ChartWall class. The also has two special walls: RadarWall and PolarWall, which are used as Plotting Area backplanes for Radar Charts and Polar Charts.
Header and Footer
Header and Footer of the Chart Image. Each Label displayed in the Chart Image is represented by a ChartLabel object.
Data Point Label
A special label that occurs with a data point, slightly offset from where the point is plotted. It can be the data point value, or custom text. Data Point Labels are controlled on a per-Series basis with an instance of the DataLabels class attached to each Series derived from the Series class.
Marker
A shape with controlled size and appearance displayed for each Data Point. Markers are controlled on a per-Series basis with an instance of the Markers class attached to each Series derived from the Series class.