Radar charts are created with the help of an instance of the RadarSeries class. When an object of this type exists in the Series collection, the component will automatically hide all other series and display only the series of type Radar. It is derived from the Series base class and inherits all its functionality. The following figure represents a typical radar chart.
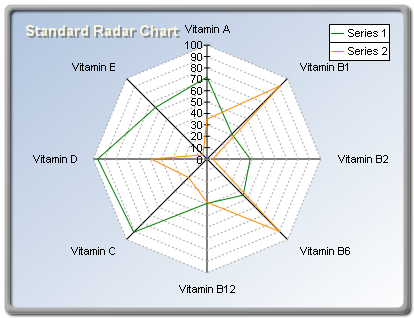 figure 1.
Creating the radar series
An instance of the RadarSeries class can be obtained from the SeriesCollection. Add method. The method will add the newly created series to the Series collection and return a reference to it. If the user wants to save the reference for further use, it must be explicitly cast to the RadarSeries type. The following code will create a RadarSeries object in the Series collection and save the returned reference:
| VB.NET |
|
' there is one chart created by default
Dim chart As Chart = CType(nChartControl1.Charts(0), Chart)

' and add a radar series to it
Dim radar As RadarSeries = CType(chart.Series.Add(SeriesType.Radar), RadarSeries)
|
| C# |
|
// there is one chart created by default
Chart chart = (Chart)chartControl1.Charts[0];
// and add a radar series to it
RadarSeries radar = (RadarSeries)chart.Series.Add(SeriesType.Radar);
|
Passing Data to the Radar Series
Once the radar series is created you can add data to it. Radar series use the Values data series of its base class for the bar values. The helper methods provided by the Series class can be used to insert values into the data series that are to be used. For example, the following code will add three values to the radar series.
| VB.NET |
|
radar.Add(10)
radar.Add(15)
radar.Add(12)
|
| C# |
|
radar.Add(10);
radar.Add(15);
radar.Add(12);
|
A labeled radar chart is also easily created:
| VB.NET |
|
radar.AddPolar(10, "Label1")
radar.AddPolar(20, "Label2")
radar.AddPolar(15, "Label3")

' show only the labels in the data label
radar.DataLabels.Mode = DataLabelsMode.Every
radar.DataLabels.Format = "<label>"
|
| C# |
|
radar.AddPolar(10, "Label1");
radar.AddPolar(20, "Label2");
radar.AddPolar(15, "Label3" );

// show only the labels in the data labels
radar.DataLabels.Mode = DataLabelsMode.Every;
radar.DataLabels.Format = "<label>";
|
Controlling Radar Style
The radar series can be displayed in Line and FilledArea styles ( Line style is the default). The user can easily control this aspect of a radar series with Style property of the RadarSeries class. The following code will display a radar series in filled area style:
| VB.NET |
|
radar.Style = RadarStyle.FilledArea
|
| C# |
|
radar.Style = RadarStyle.FilledArea;
|
The image in figure two represents a filled area radar chart:
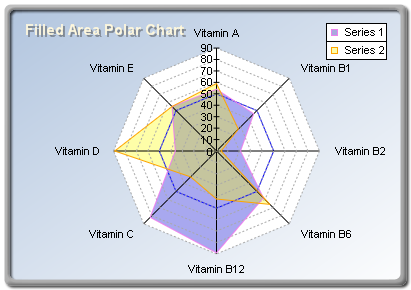
figure 2.
Controlling the Appearance of the Radar Series
The appearance of the radar series is controlled by the RadarFillEffect and RadarBorder properties of the RadarSeries class. When the radar is rendered in Line style, the RadarBorder property determines the style of the radar line. In FilledArea mode the fill effect applied to the radar area is controlled by the RadarFillEffect property. For example, you can change the line color of a Line radar with the following code:
| VB.NET |
|
radar.RadarBorder.Color = Color.Blue
|
| C# |
|
radar.RadarBorder.Color = Color.Blue;
|
Similarly, you can change the fill effect of a filled area radar with the following code:
| VB.NET |
|
radar.RadarFillEffect.SetSolidColor(Color.Green)
|
| C# |
|
radar.RadarFillEffect.SetSolidColor(Color.Green);
|
Please refer to the Series Appearance topic, which describes how to apply individual fillings and lines to the series data points.
Controlling the radar X and Y radius
The radar X and Y radiuses are bound to the chart width and height properties respectively. That is why a newly created radar chart can look "squashed": the chart width is by default larger than the chart depth. The following code will create a perfectly round radar chart (assuming that the radar series is already created):
| VB.NET |
|
Chart.Width = 1.5F ' x radius is set to 1.5
Chart.Height = 1.5F ' y radius is set to 1.5
|
| C# |
|
Chart.Width = 1.5f; // x radius is set to 1.5
Chart.Height = 1.5f; // y radius is set to 1.5
|
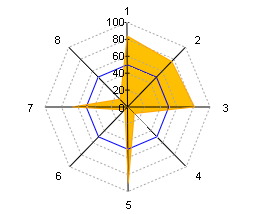
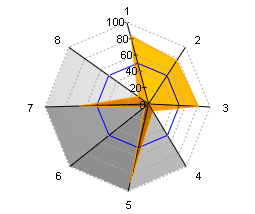
Controlling Radar Depth
A unique feature of Xceed Chart for WinForms is its ability to display a radar chart with an elevated center. The depth of the chart is controlled by the chart depth. The following code snippets display "flat" and "extruded" radar charts, respectively (previewed in the table that follows).
| VB.NET |
|
' display the radar in ordinary "flat" mode
chart.Depth = 0

' display the radar in "extruded" mode
chart.Depth = 0.5F
|
| C# |
|
// display the radar in ordinary "flat" mode
chart.Depth= 0;
// display the radar in "extruded" mode
chart.Depth = 0.5f;
|
| Flat and Extruded Radar Charts |
 |
 |
See Also
RadarSeries | RadarAxis