Polar charts are created with the help of an instance of the PolarSeries class. When an object of this type exists in a Series collection, the component will automatically hide all other series and display only the series of type Polar. It is derived from the Series base class and inherits all its functionality. The following figure represents a typical polar chart.
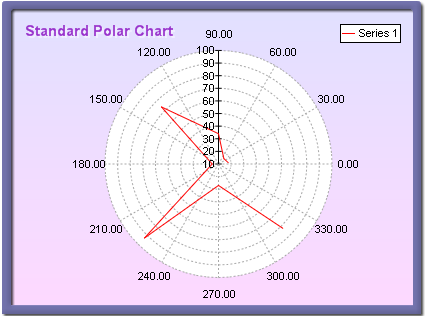
figure 1.
Creating the Polar Series
An instance of the PolarSeries class can be obtained from the SeriesCollection.Add method. The method will add the newly created series to the series collection and return a reference to it. If the user wants to save the reference for further use, it must be explicitly cast to the PolarSeries type. The following code will create a PolarSeries object in the series collection and save the returned reference:
| VB.NET | |
|---|---|
| |
| C# | |
|---|---|
// there is one chart created by default // add a polar series to it | |
Passing Data to the Polar Series
Once the polar series is created, you can add data to it. Polar series use the Values data series of its base class for the polar data point radius (distance from the polar center). User can employ the helper methods provided by the Series class to insert values into the data series they intends to use.
In addition to the standard Values data series, the polar series also adds another data series of type Double, which holds the polar data point angles. It is accessible through the Angles property of the PolarSeries class.
Furthermore, in addition to the standard helper methods inherited from Series for feeding data (see the One Value Series Functionality topic for more information), the PolarSeries implements the following routines.
void AddPolar(double value, double angle) - Adds a new polar point data point.
void AddPolar(double value, double angle, string label) - Adds a new polar data point with associated label.
void AddPolar(double value, double angle, string label, FillEffect polarFE) - Adds a new polar data point with associated label and fill effect.
void AddPolar(double value, double angle, string label, FillEffect polarFE, LineProperties polarBorder) - Adds a new polar data point with associated label, fill effect and line properties.
For example, you can feed data to a simple polar chart with the following code:
| VB.NET | |
|---|---|
| |
| C# | |
|---|---|
polar.AddPolar(10, 30); // radius 10, angle 30 degrees | |
Or create a polar with labels:
| VB.NET | |
|---|---|
| |
| C# | |
|---|---|
polar.AddPolar(10, 30, "Label1"); // radius 10, angle 30 degrees and label // show only the labels in the data labels | |
Controlling the Polar X and Y Radius
The polar X and Y radiuses are bound to the chart's width and height properties, respectively. That is why a newly created polar chart can look "squashed": the chart width is by default larger than the chart depth. The following code will create a perfectly round polar chart (assuming that the polar series is already created).
| VB.NET | |
|---|---|
| |
| C# | |
|---|---|
Chart.Width = 1.5f; // x radius is set to 1.5 | |
Controlling the Polar Style
The polar series can be displayed in Line and FilledArea styles ( Line style is the default). The user can easily control this aspect of the polar series with the help of the Style property of the PolarSeries class. The following code will display a polar series in FilledArea style:
| VB.NET | |
|---|---|
polar.Style = PolarStyle.FilledArea | |
| C# | |
|---|---|
polar.Style = PolarStyle.FilledArea; | |
The image on figure two represents a filled area polar chart:
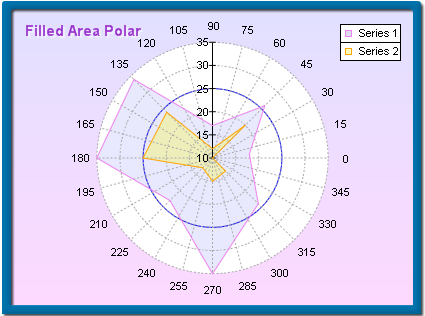
figure 2.
Controlling the Appearance of the Polar Series
The appearance of a polar series is controlled with the PolarFillEffect and PolarBorder properties of the PolarSeries class. When the radar is rendered in Line style the PolarBorder property determines the style of the radar line. In FilledArea mode the fill effect applied to the radar area is controlled by the PolarFillEffect property. For example, in the case of a Line polar you can change the line color with the following code:
| VB.NET | |
|---|---|
polar.PolarBorder.Color = Color.Blue | |
| C# | |
|---|---|
polar.PolarBorder.Color = Color.Blue; | |
Similarly, you can change the fill effect of a filled area polar with the following code:
| VB.NET | |
|---|---|
radar.PolarFillEffect.SetSolidColor(Color.Green) | |
| C# | |
|---|---|
radar.PolarFillEffect.SetSolidColor(Color.Green); | |
Please refer to the Series Appearance topic, which describes how to apply individual fillings and lines to the data points of a series.
Closing the Polar Contour
The user can easily close the polar contour with the CloseContour property of the PolarSeries class. When set to true the polar series will automatically connect the first and last polar series data points.
Polar Series with Markers
Polar Series support Markers. The user can control the appearance of the markers displayed on each polar data point with the Markers object accessible from the Markers property of the base Series class. The following code example shows the polar markers as bars with blue color filling.
| VB.NET | |
|---|---|
| |
| C# | |
|---|---|
polar.Markers.Visible = true; | |
The following image represents a polar chart with markers.
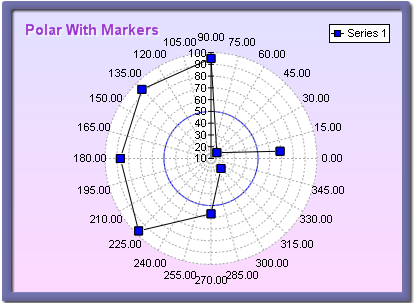
figure 3.
Polar Series Formatting Commands
The PolarSeries class extends the formatting command set inherited from the Series base class with the following formatting commands:
<angle_in_degrees> - The current data point angle in degrees (extracted from the Angles data series)
<angle_in_radians> - The current data point angle in radians (extracted from the Angles data series)
Related Examples
Windows Forms: Series\Polar\Standard Polar
Windows Forms: Series\Polar\Filled Area Polar