Axis Text Generation
The texts displayed by the axes are generated by the current active scale. The default texts represent the value of the major tick on which they are placed. For example, a Dimension scale will generate numbers representing the dimension index (0, 1, 2, 3, etc.), while a Numeric scale can generate values such as 1.3, 1.5, 1.7, etc. In some cases, it is useful to change the default axis text generation and display your own texts on major ticks. The chart on figure 1 demonstrates this.
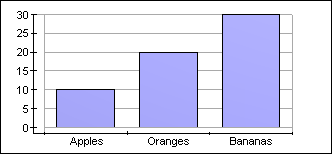
figure 1.
The code reproducing the axis texts of the PrimaryX axis is as follows:
| VB.NET | |
|---|---|
| |
| C# | |
|---|---|
| |
Axis Text Formatting
The formatting of automatically generated axis texts is controlled by the ValueFormatting object accessible from the ValueFormatting property of the axis. This property often needs to be modified to reflect the nature of the values displayed on the axis. For example, in a date-time chart you need to manually set the value format to Date:
| VB.NET | |
|---|---|
| |
| C# | |
|---|---|
| |
It is also often required to display the values of the numeric scale as currency:
| VB.NET | |
|---|---|
| |
| C# | |
|---|---|
| |
or as a percentage:
| VB.NET | |
|---|---|
| |
| C# | |
|---|---|
| |
| Axis Value Formatting | ||
| DateTime XAxis | Currency YAxis | Percentage YAxis |
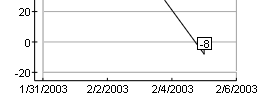 |
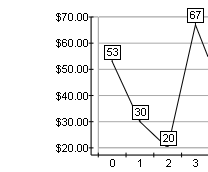 |
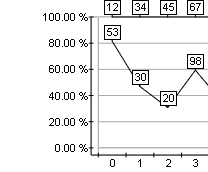 |
Axis Text Layout
The user can control the layout of the displayed axis texts. This is particularly useful in the case of a custom labeled PrimaryX axis on which the labels are long strings and often overlap. You can resolve this with several approaches:
1. Staggered texts: Staggered texts are displayed on several levels. The user can control the number of stagger levels as well as the distance between each level. The properties implementing staggered texts are:
StaggerTexts: Enables or disables staggered text mode.
StaggerLevels: Controls the number of stagger levels.
StaggerOffset: Controls the offset of the staggered texts.
The chart on figure 2 is a typical example of staggered labels.
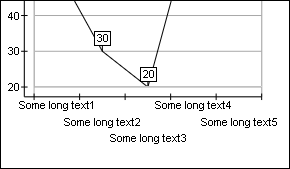
figure 2.
The code replicating this behaviour follows:
| VB.NET | |
|---|---|
| |
| C# | |
|---|---|
| |
2. Use a predefined text layout: This is a very useful feature for configuring the layout of axis text. The predefined text layout is a specific combination of text offset, alignment, orientation, and stagger. It is applied with the SetPredefinedTextLayout method of the Axis class. It also takes into account the PredefinedChartStyle setting. It is of type PredefinedTextLayout. For example, if you want to display the PrimaryX axis texts vertically, you can use the following code:
| VB.NET | |
|---|---|
chart.Axis(StandardAxis.PrimaryX).SetPredefinedTextLayout(PredefinedTextLay.Vertical) | |
| C# | |
|---|---|
chart.Axis(StandardAxis.PrimaryX).SetPredefinedTextLayout(PredefinedTextLayout.Vertical); | |
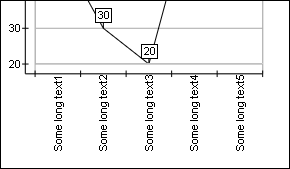
figure 3.
Axis Text Appearance
The user can control the appearance of axis texts with the ChartText object accessible from the Text property of the Axis class.
| VB.NET | |
|---|---|
| |
| C# | |
|---|---|
| |
Axis Title
The axis title is a string displayed parallel to the axis orientation. The string itself is controlled by the Title property. The appearance of the title string is controlled by the TitleText property.
| VB.NET | |
|---|---|
| |
| C# | |
|---|---|
| |