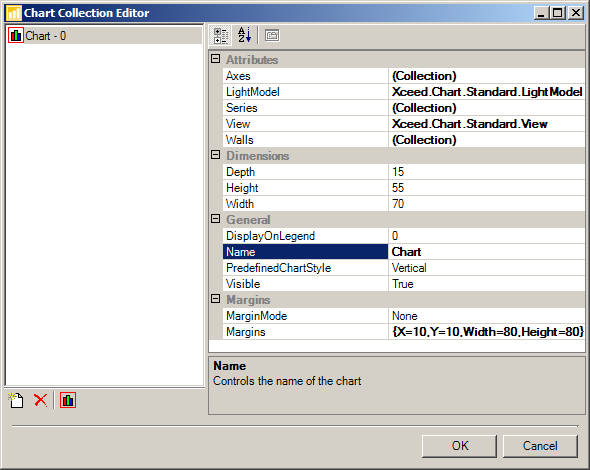
The Chart Collection Editor is used to edit the charts displayed by the control.
Commands
Add Chart: Adds a new chart.
Delete Chart: Deletes the currently selected chart.
Active Chart: Sets the active chart (displayed with a red border). The active chart is the one that receives mouse input.
Chart Margins
The chart margins control group defines the margins of the chart as a percentage of the chart control canvas. By default, the chart occupies the entire canvas. You can use these properties to position your charts or just split the canvas space among the existing charts.
Chart Attributes
-
Axes: Shows the Axis Collection Editor.
-
Chart View: Shows the Chart View Object Editor.
-
LightModel: Shows the LightModel Object Editor.
-
Series: Shows the Series Collection Editor.
-
Walls: Shows the Wall Collection Editor.
General Chart Settings
-
Name: The name of the chart. May be displayed by the ChartGridControl.
-
Width, Height, Depth: Define the dimensions of the chart.
-
Visible: Controls the chart's visibility.
-
PredefinedChartStyles: Specifies a predefined chart orientation.
-
DisplayOnLegend: The index of the legend on which this chart is described.