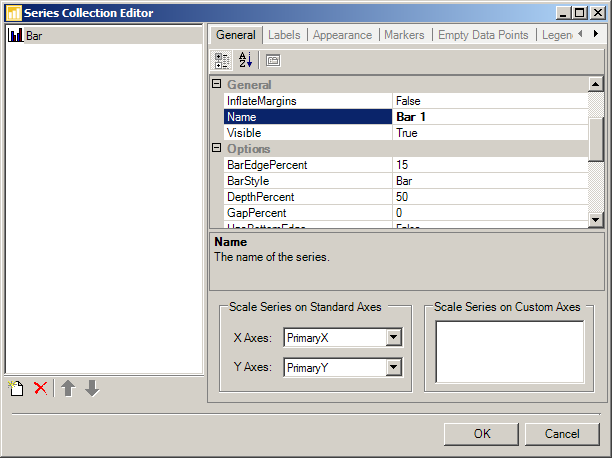
The Series Collection Editor is used to edit the series displayed by the Xceed Chart control.
Commands
Add Series: Adds a new series from the type that the user specifies.
Delete Series: Deletes the currently selected series.
Move Series Up: Moves the series up in the collection.
Move Series Down: Moves the series down in the collection.
Series Appearance
The properties in this group define the appearance of the series data points. They are divided into two categories: line properties and fill effect properties. Fill effects are applied on all data points when Appearance.FillMode is set to Series. Line properties are applied to all data points when the Appearance.LineMode is set to Series. For more information, please refer to the Appearance topic.
Series Attributes
Contains objects attached to this series controlling various aspects of the series:
-
Appearance: An Appearance object.
-
DataLabels: A DataLabels object. For more information, see the Data Labels topic.
-
EmptyDataPointsAppearance: An EmptyDataPointsAppearance object. For more information, see the Empty Data Points Overview topic.
-
Interactivity: A SeriesInteractivity object. .
-
Legend: A SeriesLegend object. For more information see the Legend topic.
Series Formatting
Contains several ValueFormatting objects that define the formatting of the values they represent. For more information, please refer to the One Value Series Functionality topic.
-
Data: Shows the Legend Data Items editor.
-
Footer: Shows the legend footer text settings.
-
Header: Shows the legend header text settings.
-
Mode: Defines the way in which the legend is populated with items.
Series General
Name, Visible and InflateMargins flags.
Series Options
Series type-specific properties.
Data Points Tab
In this tab you can instantly change the values displayed by the series, as well as change the data series format. The latter may be required if, for example, you want to create a date-time XY scatter chart and want to edit the X positions as true date-time values. In this case, you can change the default representation of the XValues data series by clicking on the Edit Data Series button and by simply changing the XValues -> ValueFormat - Format property to Date.
See Also
SeriesBase | Series | XYScatterSeries | SeriesCollection | General Concepts and Terminology