Xceed Toolkit for Maui v2.0 Documentation
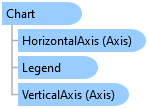
Chart Class
'DeclarationPublic Class Chart Inherits Control Implements Microsoft.Maui.Controls.IAnimatable, Microsoft.Maui.Controls.IEffectControlProvider, Microsoft.Maui.Controls.IElementController, Microsoft.Maui.Controls.IGestureRecognizers, Microsoft.Maui.Controls.ILayout, Microsoft.Maui.Controls.ILayoutController, Microsoft.Maui.Controls.Internals.IGestureController, Microsoft.Maui.Controls.IViewController, Microsoft.Maui.Controls.IVisualElementController, Microsoft.Maui.HotReload.IHotReloadableView, Microsoft.Maui.IContentView, Microsoft.Maui.IContextFlyoutElement, Microsoft.Maui.ICrossPlatformLayout, Microsoft.Maui.IElement, Microsoft.Maui.IPadding, Microsoft.Maui.IPropertyMapperView, Microsoft.Maui.IReplaceableView, Microsoft.Maui.IToolTipElement, Microsoft.Maui.ITransform, Microsoft.Maui.IView, Microsoft.Maui.IVisualTreeElement
'UsageDim instance As Chart
public class Chart : Control, Microsoft.Maui.Controls.IAnimatable, Microsoft.Maui.Controls.IEffectControlProvider, Microsoft.Maui.Controls.IElementController, Microsoft.Maui.Controls.IGestureRecognizers, Microsoft.Maui.Controls.ILayout, Microsoft.Maui.Controls.ILayoutController, Microsoft.Maui.Controls.Internals.IGestureController, Microsoft.Maui.Controls.IViewController, Microsoft.Maui.Controls.IVisualElementController, Microsoft.Maui.HotReload.IHotReloadableView, Microsoft.Maui.IContentView, Microsoft.Maui.IContextFlyoutElement, Microsoft.Maui.ICrossPlatformLayout, Microsoft.Maui.IElement, Microsoft.Maui.IPadding, Microsoft.Maui.IPropertyMapperView, Microsoft.Maui.IReplaceableView, Microsoft.Maui.IToolTipElement, Microsoft.Maui.ITransform, Microsoft.Maui.IView, Microsoft.Maui.IVisualTreeElement
A Chart can contain multiple Series; each of those Series can be customized as seen fit.
All of the Chart's parts, like its Axis, Legend, etc., can also be customized as needed.
Note that Xceed's Chart currently supports line charts & bar charts only.
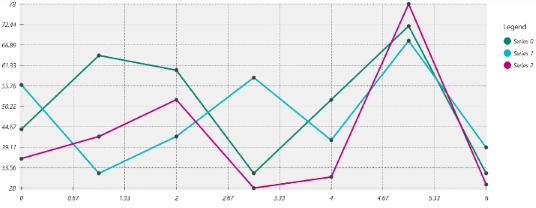
<xctk:Chart ShowLegend="True">
  <xctk:Chart.Series>
    <xctk:Series>
      <xctk:Series.DataPoints>
        <xctk:DataPoint X="0"
                        Y="44"/>
        <xctk:DataPoint X="1"
                        Y="64"/>
        <xctk:DataPoint X="2"
                        Y="60"/>
        <xctk:DataPoint X="3"
                        Y="32"/>
        <xctk:DataPoint X="4"
                        Y="52"/>
        <xctk:DataPoint X="5"
                        Y="72"/>
        <xctk:DataPoint X="6"
                        Y="32"/>
      </xctk:Series.DataPoints>
    </xctk:Series>
    <xctk:Series>
      <xctk:Series.DataPoints>
        <xctk:DataPoint X="0"
                        Y="56"/>
        <xctk:DataPoint X="1"
                        Y="32"/>
        <xctk:DataPoint X="2"
                        Y="42"/>
        <xctk:DataPoint X="3"
                        Y="58"/>
        <xctk:DataPoint X="4"
                        Y="41"/>
        <xctk:DataPoint X="5"
                        Y="68"/>
        <xctk:DataPoint X="6"
                        Y="39"/>
      </xctk:Series.DataPoints>
    </xctk:Series>
    <xctk:Series>
      <xctk:Series.DataPoints>
        <xctk:DataPoint X="0"
                        Y="36"/>
        <xctk:DataPoint X="1"
                        Y="42"/>
        <xctk:DataPoint X="2"
                        Y="52"/>
        <xctk:DataPoint X="3"
                        Y="28"/>
        <xctk:DataPoint X="4"
                        Y="31"/>
        <xctk:DataPoint X="5"
                        Y="78"/>
        <xctk:DataPoint X="6"
                        Y="29"/>
      </xctk:Series.DataPoints>
    </xctk:Series>
  </xctk:Chart.Series>
</xctk:Chart>
System.Object
Microsoft.Maui.Controls.BindableObject
Microsoft.Maui.Controls.Element
Microsoft.Maui.Controls.NavigableElement
Microsoft.Maui.Controls.VisualElement
Microsoft.Maui.Controls.View
Microsoft.Maui.Controls.Compatibility.Layout
Microsoft.Maui.Controls.TemplatedView
Xceed.Maui.Toolkit.Control
Xceed.Maui.Toolkit.Chart
Target Platforms: Windows 11, Windows 10, Windows 7, Windows Vista SP1 or later, Windows XP SP3, Windows Server 2008 (Server Core not supported), Windows Server 2008 R2 (Server Core supported with SP1 or later), Windows Server 2003 SP2