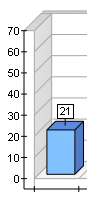
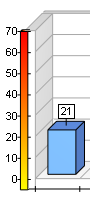
The axes of Xceed Chart can be displayed as simple lines, bars or tubes. The following figures visually demonstrate the three axis styles:
 |
 |
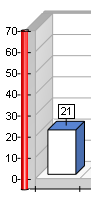 |
| Axis with Line style | Axis with Bar style | Axis with Tube style |
Controlling the Axis Style
The AxisStyle property of the Axis object controls the shape of the axis. It is of type AxisStyle and can accept the following values (for details, see AxisStyle Enumeration):
Line
Bar
Tube
By default it is set to Line. The Width property of the Axis object controls the width of the axis when it is displayed with tube or bar style. By default it is set to 0.06 Model units. The following example will change the PrimaryY axis style to tube and increase its size:
| VB.NET | |
|---|---|
| |
| C# | |
|---|---|
| |
Controlling the Axis Appearance
When the axis is displayed with line style, the user can control the properties of the line with the LineProperties object accessible from the Border property. The following example displays the PrimaryX axis in red with a 2-pixel thick line.
| VB.NET | |
|---|---|
| |
| C# | |
|---|---|
| |
When the axis is displayed with tube or bar style, the user can control the filling of the axis with the help of the FillEffect object accessible throug the FillEffect property. In this case the Border property controls the border of the rendered tube or bar. The following example sets the filling of the PrimaryY axis as blue and displays it without a border.
| VB.NET | |
|---|---|
| |
| C# | |
|---|---|
| |
Related Examples
Windows Forms: Axes\General\Appearance