Stock candle charts are created with the help of an instance of the StockSeries object. It is derived from the XYScatterSeries base class and inherits all its functionality. Stock candles are created when the CandleStyle property of the StockSeries object is set to Bar.
| VB.NET |
|
stock.CandleStyle = CandleStyle.Bar stock.CandleStyle = CandleStyle.Bar
|
| C# |
|
stock.CandleStyle = CandleStyle.Bar; stock.CandleStyle = CandleStyle.Bar;
|
The following figure represents a typical stock candle chart.
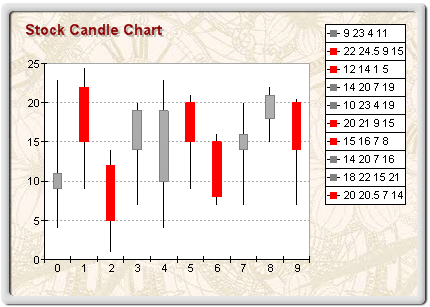
figure 1.
Creating the Stock Candle Series
An instance of the StockSeries class can be obtained from the SeriesCollection.Add method. The method will add the newly created series to the series collection and return a reference to it. If the user wants to save the reference for further use, it must explicitly be cast to the StockSeries type. The following code will create a StockSeries object in the series collection and save the returned reference:
| VB.NET |
|
' there is one chart created by default Dim chart As Chart = CType(chartControl1.Charts(0), Chart) Dim stock As StockSeries = CType(chart.Series.Add(SeriesType.Stock), tockSeries)
|
| C# |
|
// there is one chart created by default
Chart chart = (Chart)chartControl1.Charts[0];
StockSeries stock = (StockSeries)chart.Series.Add(SeriesType.Stock); |
Passing Data to the Stock Candle Series
Once the stock series is created, you can add data to it. Stock series use the Values data series of its base class for the Open values. For consistency this data series can also be accessed with the help of the OpenValues property.
In addition to the standard Values (OpenValues ) and XValues data series, the stock series also adds several data series of type Double, which hold the High, Low, and Close values, respectively. They are accessible through the HighValues, LowValues, and CloseValues property of StockSeries object.
The StockSeries class implements the following helper routines for passing data to the candle stock series with mandatory Open and Close values, since the candle stock chart requires them.
void AddStock(double open, double close) - Adds (open - close) values.
void AddStock(double open, double high, double low, double close) - Adds (open - high - low - close) values.
void AddStock(double xvalue, double open, double close) - Adds (open - close) values with custom X position.
void AddStock(double xvalue, double open, double high, double low, double close) - Adds (open - high - low - close) values with custom X position.
For example, if you want to create a simple candle chart, you can use the following code:
| VB.NET |
|
stock.AddStock(10, 14) stock.AddStock(15, 11) stock.AddStock(12, 17) stock.ShowHighLow = False
|
| C# |
|
stock.AddStock(10, 14);
stock.AddStock(15, 11);
stock.AddStock(12, 17);
stock.ShowHighLow = false; |
An open-high-low-close stock with candle style is created by the following code:
| VB.NET |
|
stock.AddStock(10, 22, 8, 14) stock.AddStock(10, 19, 9, 13) stock.AddStock(17, 25, 12, 16)
|
| C# |
|
stock.AddStock(10, 22, 8, 14);
stock.AddStock(10, 19, 9, 13);
stock.AddStock(17, 25, 12, 16);
|
A more complex date-time stock chart can be displayed like this:
| VB.NET |
|
stock.AddStock(New DateTime(2003, 3, 24).ToOADate(), 10, 22, 8, 14) stock.AddStock(New DateTime(2003, 4, 14).ToOADate(), 10, 19, 9, 13) stock.AddStock(New DateTime(2003, 5, 54).ToOADate(), 17, 25, 12, 16) stock.UseXValue = True // instruct the chart to use the custom x date time positions stock.UseXValues = True chart.Axis(StandardAxis.PrimaryY).ScaleMode = AxisScaleMode.DateTime
|
| C# |
|
stock.AddStock(new DateTime(2003, 3, 24).ToOADate(), 10, 22, 8, 14);
stock.AddStock(new DateTime(2003, 4, 14).ToOADate(), 10, 19, 9, 13);
stock.AddStock(new DateTime(2003, 5, 54).ToOADate(), 17, 25, 12, 16);
stock.UseXValue = true;
// instruct the chart to use the custom x date time positions
stock.UseXValues = true;
chart.Axis(StandardAxis.PrimaryY).ScaleMode = AxisScaleMode.DateTime; |
Controlling the Candle Size
The width of the candles is specified by the CandleWidth property. By default it is set to 2.5f Model Units. The depth of the candle is specified as a percentage of the floor grid-cell they occupy. This percentage value is specified by the CandleDepthPercent property. By default it is set to 50. The following code will display larger candles:
| VB.NET |
|
candle.CandleWidth = 3 candle.CandleDepthPercent = 70
|
| C# |
|
candle.CandleWidth = 3;
candle.CandleDepthPercent = 70; |
Controlling the High-Low line appearance
Stock charts display a line connecting the high and low values. Its visibility is controlled by the ShowHighLow property, which is by default set to true. The line is displayed with the properties specified by the LineProperties object accessible through the HighLowLineProps property. The following code will display the high-low line in red with a width of 2 pixels:
| VB.NET |
|
stock.HighLowLine.Color = Color.Red stock.HighLowLine.Width = 2
|
| C# |
|
stock.HighLowLine.Color = Color.Red;
stock.HighLowLine.Width = 2; |
Controlling the Candle Appearance
A candle is considered to have an "up" orientation if its open value is smaller than its close value. Otherwise, it is considered to have a "down" orientation. "Up" candles are filled with the filling specified by the UpFillEffect property, and the border is extracted from the UpLineProps property. Analogously, "down" candles are filled with the filling specified by the DownFillEffect property, and the border is extracted from the DownLineProps property. By default the "up" filling is solid grey, while the "down" filling is solid red. The following code will display the "up" candles in blue and the
"down" candles in green:
| VB.NET |
|
stock.UpFillEffect.SetSolidColor(Color.Blue) stock.DownFillEffect.SetSolidColor(Color.Green)
|
| C# |
|
stock.UpFillEffect.SetSolidColor(Color.Blue);
stock.DownFillEffect.SetSolidColor(Color.Green); |
Stock Candle Formatting Commands
The StockSeries class extends the formatting command set inherited from the XYScatterSeries base class with the following formatting commands:
<open> - The current data point open value (extracted from the OpenValues data series).
<high> - The current data point high value (extracted from the HighValues data series).
<low> - The current data point low value (extracted from the LowValues data series).
<close> - The current data point close value (extracted from the CloseValues data series).
<up_label> - In the case of a candle with UP orientation, it is replaced with string specified by the UpLabel property.
<down_label> - In the case of a candle with DOWN orientation, it is replaced with string specified by the DownLabel property.
For example, if you want to display the open and close values in the legend, you must use the following code:
| VB.NET |
|
stock.Legend.Mode = SeriesLegendMode.DataPoints stock.Legend.Format = "<open> <close>"
|
| C# |
|
stock.Legend.Mode = SeriesLegendMode.DataPoints;
stock.Legend.Format = "<open> <close>"; |
In the more complex scenario of a date-time stock chart, you may want to display the dates in the legend:
| VB.NET |
|
stock.Legend.Mode = SeriesLegendMode.DataPoints stock.Legend.Format = "<xvalue>" stock.XValues.ValueFormat.Format = ValueFormat.Date
|
| C# |
|
stock.Legend.Mode = SeriesLegendMode.DataPoints;
stock.Legend.Format = "<xvalue>";
stock.XValues.ValueFormat.Format = ValueFormat.Date; |
Stock Candle Legend
When the Mode property of the SeriesLegend object accessible through the Legend property of the SeriesBase base class is set to SeriesLogic, the stock series will add two legend entries to the legend, for the "up" and the "down" oriented candles. The legend marks will be filled with the "up" and "down" fillings, respectively. The UpLabel string is associated with the "up" legend items, while the DownLabel string is associated with the "down" legend items.
| VB.NET |
|
stock.Legend.Mode = SeriesLegendMode.SeriesCustom |
| C# |
|
stock.Legend.Mode = SeriesLegendMode.SeriesLogic; |
See the Series Legend topic for more information.
Related Examples
Windows Forms: Series\Stock\Candle
Windows Forms: Series\Stock\DateTime Stock
Windows Forms: Series\Combo Charts\Financial chart example
See Also
StockSeries