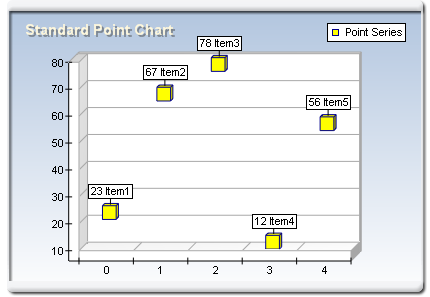
Standard Point charts are created by using an instance of the PointSeries object. It is derived from the XYScatterSeries base class and inherits all its functionality. The following figure represents a typical point chart.

figure 1.
Creating the Standard Point Series
An instance of the PointSeries class can be obtained from the SeriesCollection.Add method. The method will add the newly created series to the series collection and return a reference to it. If the user wants to save the reference for further use, it must be explicitly cast to the PointSeries type. The following code will create a PointSeries object in the series collection and save the returned reference:
| VB.NET | |
|---|---|
| |
| C# | |
|---|---|
// there is one chart created by default // add point series to it | |
Passing Data to the Standard Point Series
Once the point series is created, you can add data to it. A point series uses the Values data series of its base class for the point values. The helper methods provided by the Series and XYScatterSeries classes can be used to insert values in the data series that are to be used.
In addition to the standard Values and XValues data series, the point series also adds another data series of type Double, which holds the point Z custom positions. It is accessible through the ZValues property of PointSeries object.
In addition to the standard helper methods for feeding data inherited from the Series class (see the One Value Series Functionality topic) and the XYScatterSeries class (see the XY Scatter Series Functionality topic), the PointSeries implements the following routines.
void AddPoint(double dValue, double dXValue, double dZValue) - Adds a point with associated Y, X, and Z values.
void AddPoint(double dValue, double dXValue, double dZValue, string sLabel) - Adds a point with associated Y, X, and Z values, and fill effect.
void AddPoint(double dValue, double dXValue, double dZValue, string sLabel, FillEffect lineFE) - Adds a point with associated Y, X, and Z values, plus label and fill effect.
void AddPoint(double dValue, double dXValue, double dZValue, string sLabel, FillEffect lineFE, LineProperties lineBorder) - Adds a point with associated Y, X, and Z values, plus label, fill effect, and line properties.
Controlling the Point Shape
The shape of the point segments can be controlled with the PointStyle property. It is of type PointStyle and accepts the following values (for details, see PointStyle Enumeration):
Bar = 0
Cylinder
Cone
InvertedCone
Pyramid
InvertedPyramid
Sphere
Ellipse
Cross
DiagonalCross
Star
For example, the following code will display the points as pyramids:
| VB.NET | |
|---|---|
point.PointStyle = PointStyle.Pyramid | |
| C# | |
|---|---|
point.PointStyle = PointStyle.Pyramid; | |
By default the PointStyle property is set to Bar. The size of the points is controlled with the help of the Size property. By default it is set to 4 Model units. The following code will make the points twice their original size:
| VB.NET | |
|---|---|
point.Size = 8 | |
| C# | |
|---|---|
point.Size = 8; | |
Controlling the Point Appearance
By default all points are displayed with the filling specified by the FillEffect object accessible through the PointFillEffect property and the border specified by the LineProperties object accessible through the PointBorder property. The following example displays all points in green with a blue border.
| VB.NET | |
|---|---|
| |
| C# | |
|---|---|
point.PointFillEffect.SetSolidColor(Color.Green); | |
Please refer to the Series Appearance topic, which describes how to apply individual fillings and lines to the series data points.
Standard Point Formatting Commands
The PointSeries class extends the formatting command set inherited from the Series base class with the following formatting commands:
<ZValue> - The current data point Z value (extracted from the ZValues data series).
Related Examples
Windows Forms: Series\Point\Standard Point
Windows Forms: Series\Point\XY Scatter Point