Stacked line charts are created with several instances of the LineSeries class. The first line series created must have its MultiLineMode property set to Series. The MultiLineMode property of the subsequent line series must be set to Stacked. Stacked lines series are displayed on top of each other. The following figure shows a typical stack line chart:
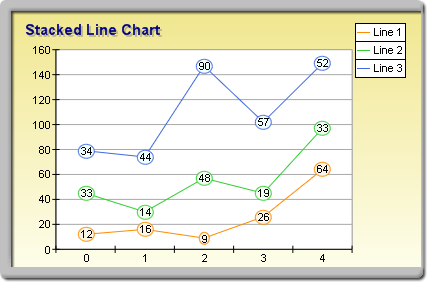
figure 1.
Creating the Stacked Line Series
The following example demonstrates how to create a stacked line chart with two stacks:
| VB.NET | |
|---|---|
| |
| C# | |
|---|---|
| |
If you want to create a second stacked line with two stacks behind the stack line created in the previous sample, you must add the following code:
| VB.NET | |
|---|---|
| |
| C# | |
|---|---|
LineSeries line4 = (LineSeries)chart.Series.Add(SeriesType.Line); line4.MultiLineMode = MultiLineMode.Series; | |
Stacked Line Charts with Negative Values
Stacked line charts support negative values, which means that if you insert negative values into the Values data series, the respective stacks will be piled below the zero. In this case, since the values for a concrete category can be both positive and negative, the chart will display two piles for each category: one for the positive values, which grows above the zero, and another one for the negative values, which grows below the zero.
The following figure demonstrates a typical stack line chart with negative and positive values:
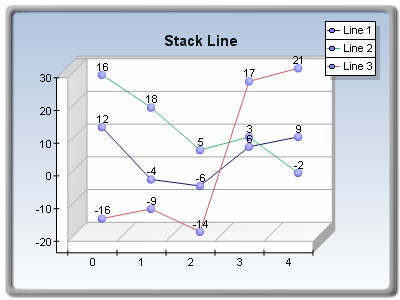
figure 2.
Stacked Line Formatting Commands
The following formatting commands inherited from the Series class have different meanings when a line series is stacked:
<total> - Displays the positive or negative values sum of the values in the current stack. If the current value is negative, the negative sum is displayed. Otherwise, the positive sum is displayed.
<cumulative> - Displays the sum of the values up to the current stack value.
<percent> - Displays the percent contribution of the value to the total pile sum.
Related Examples
Windows Forms: Series\Line\Stacked Line