Pie charts are created with an instance of the PieSeries class. When an object of this type exists in the Series collection, the component will automatically hide all other series and display only the first pie series. It is derived from the Series base class and inherits all its functionality. The following figure represents a typical pie chart.

figure 1.
Creating the pie series
An instance of the PieSeries class can be obtained from the SeriesCollection.Add method. The method will add the newly created series to the series collection and return a reference to it. If the user wants to save the reference for further use, it must be explicitly cast to the PieSeries type. The following code will create a PieSeries object in the Series collection and save the returned reference:
| VB.NET | |
|---|---|
| |
| C# | |
|---|---|
// there is one chart created by default // add a pie series to it | |
Passing Data to the Pie Series
Once the pie series is created, you can add data to it. A pie series uses the Values data series of its base class for the pie values. Users can employ the helper methods provided by the Series class to insert values in the data series he intends to use.
In addition to the standard Values data series, the pie series adds another data series of type Double, which holds the pie segment detachments from the pie center. It is accessible through the Detachments property of the PieSeries object.
Furthermore, in addition to the standard helper methods for feeding data inherited from Series (see the One Value Series Functionality topic for more information), the PieSeries implements the following routines.
void AddPie(double value, double detachment) - Adds a pie with associated detachment.
void AddPie(double value, double detachment, string label) - Adds a pie with associated detachment and label.
void AddPie(double value, double detachment, string label, FillEffect pieFE) - Adds a pie with associated detachment, label and fill effect.
void AddPie(double value, double detachment, string label, FillEffect pieFE , LineProperties pieBorder) - Adds a pie with associated detachment, label, fill effect and border properties.
For example, to create a simple pie chart with three segments, you can use code similar to this:
| VB.NET | |
|---|---|
| |
| C# | |
|---|---|
pie.Add(10); | |
A pie chart with detached segments is easy to create:
| VB.NET | |
|---|---|
| |
| C# | |
|---|---|
pie.AddPie(10, 2); | |
Typical pie chart with labels:
| VB.NET | |
|---|---|
| |
| C# | |
|---|---|
pie.Add(10, "Cool"); | |
Controlling the Shape of the Pie Series
The shape of the pie segments can be controlled from the PieStyle property. It is of type PieStyle and accepts the following values (for details, see PieStyle Enumeration):
Pie: The pies are displayed as standard pie segments with borders.
Torus: The pies are displayed as torus segments.
SmoothEdgePie: The pie are displayed with smoothed edges.
For example, the following code will display smooth-edge pies:
| VB.NET | |
|---|---|
pie.PieStyle = PieStyle.SmoothEdgePie | |
| C# | |
|---|---|
pie.PieStyle = PieStyle.SmoothEdgePie; | |
The depth of the pies is controlled through the Depth property of the Chart object in which the pie series was created. The following code will change the depth of the pie segments:
| VB.NET | |
|---|---|
chart.Depth = 30 | |
| C# | |
|---|---|
chart.Depth = 30; | |
The radius of the pies is controlled by the Width property of the Chart object in which the pie series was created. The following code will change the radius of a pie chart:
| VB.NET | |
|---|---|
chart.Width = 40 | |
| C# | |
|---|---|
chart.Width = 40; | |
When the pies are displayed as smooth-edge pies, the user can control the size of the smoothed edge with the help of the PieEdgePercent property. It specifies the edge size as a percentage of the smaller pie dimension (depth or radius). By default it is set to 25. The following code will increase the size of the pie edge:
| VB.NET | |
|---|---|
pie.PieEdgePercent = 35 | |
| C# | |
|---|---|
pie.PieEdgePercent = 35; | |
| Demonstration of Different Pie Segment Styles | ||
| Normal Pie | Torus | Smooth Edge Pie |
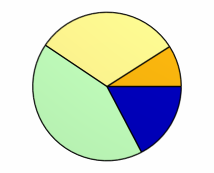 |
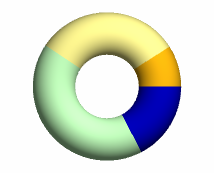 |
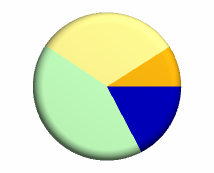 |
Controlling the Appearance of the Pie Series
By default all pies are displayed with the filling specified by the FillEffect object accessible through the PieFillEffect property, and the border specified by the LineProperties object accessible through the PieBorder property. The following example will display all pies in green with blue border.
| VB.NET | |
|---|---|
| |
| C# | |
|---|---|
pie.PieFillEffect.SetSolidColor(Color.Green); | |
Please refer to the Series Appearance topic, which describes how to apply individual fillings and lines to the series data points.
Controlling the Data Labels in the Pie Series
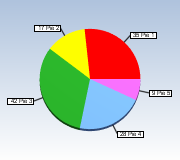
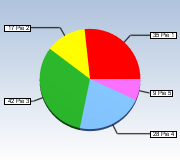
The data labels of the pie can be displayed in several modes. The LabelMode property of the PieSeries object controls the pie labels mode. It is of type PieLabelMode and can accept the following values:
Center - The data labels are displayed in the center of the pie segments.
Rim - The data labels are displayed at the rim of the pie.
Spider - The data labels are aligned in columns on the left and right side of the pie.
The following figures represent a pie chart with Center, Rim, and Spider labels.
| Demonstration of Different Pie Label Modes | ||
| Center | Rim | Spider |
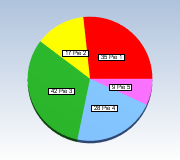 |
 |
 |
| VB.NET | |
|---|---|
pie.LabelMode = PieLabelMode.Spider | |
| C# | |
|---|---|
pie.LabelMode = PieLabelMode.Spider; | |
Miscellaneous Pie Series Settings
The BeginAngle property specifies the initial rotation of the first item. The TotalAngle property controls the total angle in degrees with which the pie is displayed. By default this property is of course 360. The following code will change the beginning angle of the pie to 30 degrees and also display it with a total of 180 degrees.
| VB.NET | |
|---|---|
| |
| C# | |
|---|---|
pie.BeginAngle = 30; | |
Figure 2 shows a half pie with begin angle set to 30 degrees.
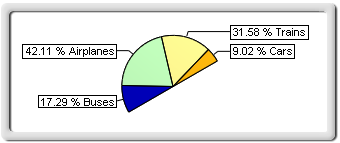
figure 2
Pie Series Formatting Commands
The PieSeries class extends the formatting command set inherited from the Series base class with the following formatting commands:
<detachment> - The current data point pie detachment value (extracted from the Detachments data series).
Related Examples
Windows Forms: Series\Pie\Standard Pie