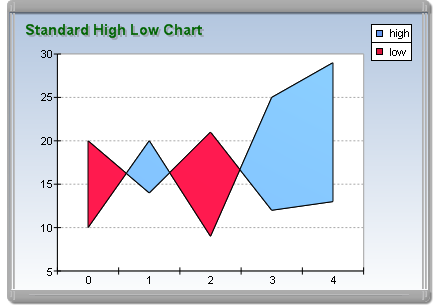
High-Low charts are created with the HighLowSeries class. It is derived from the XYScatterSeries base class and inherits all its functionality. The following figure represents a typical high-low area chart.

figure 1.
Creating the High-Low Series
An instance of the HighLowSeries class can be obtained from the SeriesCollection.Add method. The method will add the newly created series to the series collection and return a reference to it. If the user wants to save the reference for further use, it must be explicitly cast to the HighLowSeries type. The following code will create a HighLowSeries object in the series collection and save the returned reference:
| VB.NET | |
|---|---|
| |
| C# | |
|---|---|
// there is one chart created by default // add a HighLow series to it | |
Passing Data to the High-Low Series
Once the high-low series is created, you can add data to it. High-Low series use the Values data series of its base class for the high values. The user can use the helper methods provided by the Series and XYScatterSeries classes to insert values into the data series to be used.
In addition to the standard Values and XValues data series, the High-Low series also adds another data series of type Double, which holds the low values of the area segments. It is accessible through the LowValues property of HighLowSeries object.
In addition to the standard helper methods for feeding data inherited from the Series class (see the One Value Series Functionality topic) and the XYScatterSeries class (see the XY Scatter Series Functionality topic), the HighLowSeries class implements the following routines.
void AddHighLow(double high, double low) - Adds a highlow data point with high and low values.
void AddHighLow(double high, double low, double x) - Adds a highlow data point with high and low values and custom X position.
void AddHighLow(double high, double low, double x, string label) - Adds a highlow data point with high and low values and custom X position and assigned data point label.
For example:
Simple high-low chart
| VB.NET | |
|---|---|
| |
| C# | |
|---|---|
hilow.AddHighLow(12, 14); // a low area segment (high < low) | |
Date-Time high-low chart
| VB.NET | |
|---|---|
| |
| C# | |
|---|---|
| |
Controlling the Depth of the High-Low Area
The depth of the high-low area is specified as a percentage of the grid-cell depth it occupies. The DepthPercent property controls this percentage. By default it is set to 50. The following code will increase the depth of the high-low area:
| VB.NET | |
|---|---|
hilow.DepthPercent = 70 | |
| C# | |
|---|---|
hilow.DepthPercent = 70; | |
Drop Lines and High-Low Series
Drop lines are lines separating the high-low area segments. The user controls their visibility with the help of the DropLines property. By default it is set to false. The following code will display drop lines:
| VB.NET | |
|---|---|
hilow.DropLines = True | |
| C# | |
|---|---|
hilow.DropLines = true; | |
Controlling the Appearance of the High-Low Series
The appearance of the high areas (areas for which the high values are greater than the low values) is controlled by the HighFillEffect and HighBorder properties (giving you access to the attached fill effect and line properties applied on the high areas). The appearance of the low areas (areas for which the high values are smaller than the low values) is controlled by the LowFillEffect and LowBorder properties (giving you access to the attached fill effect and line properties applied to the low areas). The following code example will display the high areas in red and the low areas in blue.
| VB.NET | |
|---|---|
| |
| C# | |
|---|---|
hilow.HighFillEffect.SetSolidColor(Color.Red); | |
High-Low Series Formatting Commands
The HighLowSeries class extends the formatting command set inherited from the Series base class with the following formatting commands:
<high_value> - The current data point high value (extracted from the Values data series).
<low_value> - The current data point low value (extracted from the LowValues data series).
<high_label> - Replaced with the HighLabel string if the data point is with up orientation or with empty string if not.
<low_label> - Replaced with the LowLabel string if the data point is with down orientation or with empty string if not.
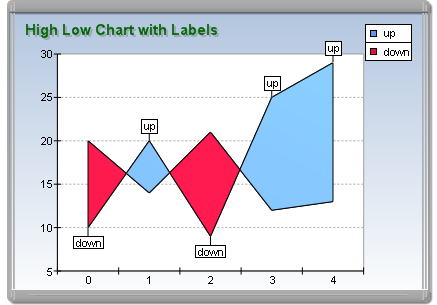
Labeling High and Low Area Segments
In specific cases it is required to apply common labels on the high and low segments of the High-Low series. The label text applied on high area segments is specified with the help of the HighLabel property. Alternatively, the label text for the low segments is specified by the LowLabel property. The user can easily display these labels in the legend and the data points. The following code demonstrates this.
| VB.NET | |
|---|---|
| |
| C# | |
|---|---|
| |

figure 2.
Related Examples
Windows Forms: Series\High Low\Standard High Low
Windows Forms: Series\High Low\Advanced High Low